

Proactive monitoring: We watch it.
We open the ticket.
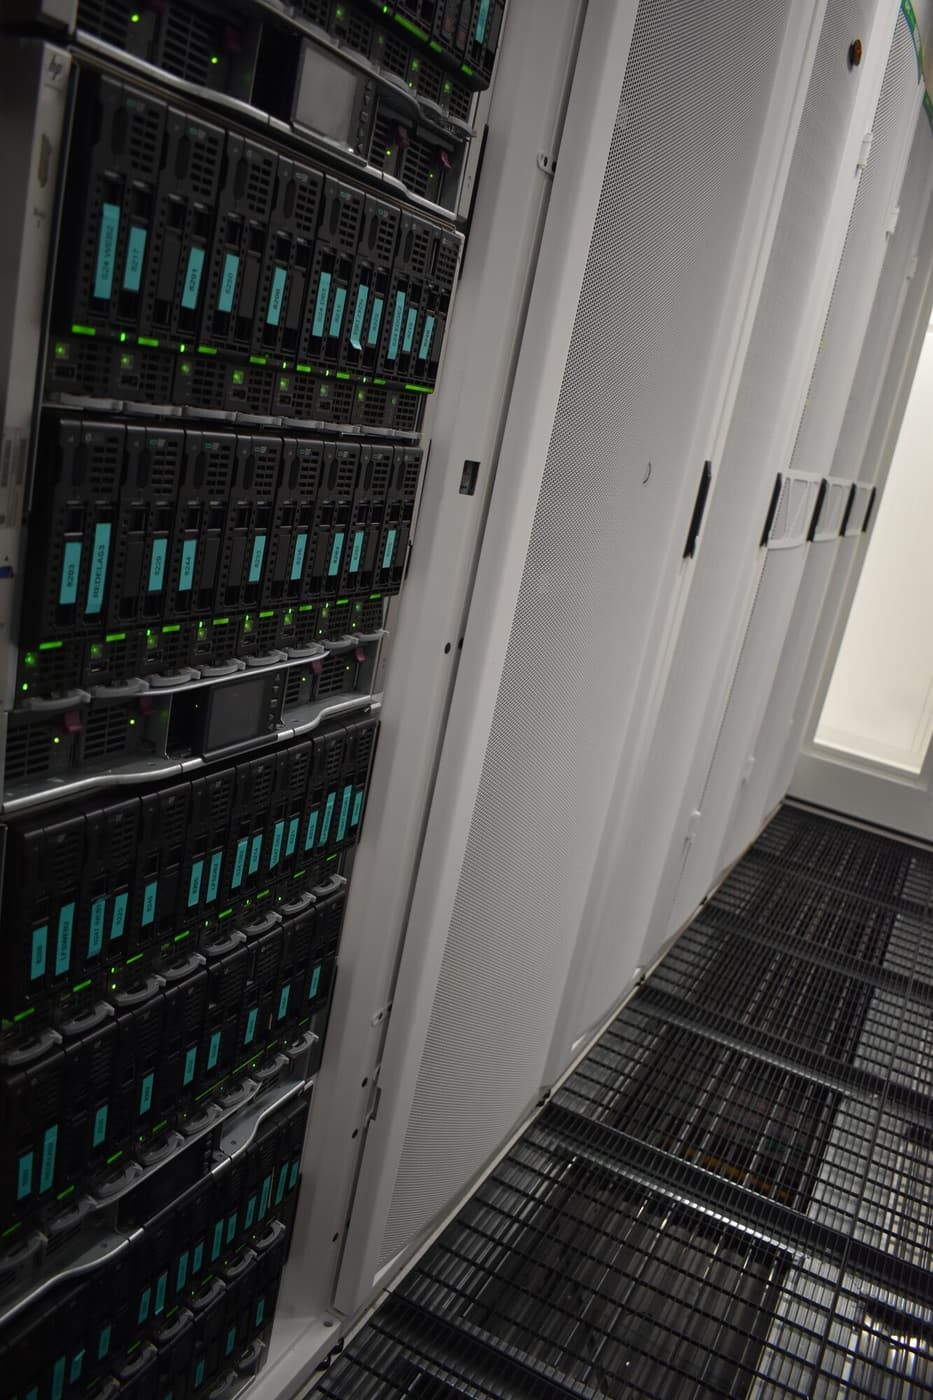
Every minuteof every day
Alarms to a personThe engineer on call, in seconds
Your real pagesStatus, content and response time
We open the ticketOften before you notice
What it is
A service you add
to any server we host.
One central Zabbix platform watches your server, its database and the pages your customers load. When something goes wrong, an engineer acts on it and tells you what happened.
An agent on the server
The Zabbix agent with the full operating system template. Hosts register themselves on first contact, so a new machine is not forgotten.
Your database, read only
Replication state, connections, buffer behaviour and slow queries, read through a dedicated monitoring account.
Your real pages
We agree with you which URLs matter, then check each one for status code, content and response time.
Thresholds tuned per server
Per host overrides instead of edited shared templates, so tuning one machine does not change the alarms on another.
Monthly, on the servers you choose.
Add it to a managed VPS, a dedicated server or the nodes of a cluster. Tell us which servers and which pages matter, and we agree the checks with you.
What we watch
From the operating system
to the page your customers load.
One platform sees the server, the network path, the storage and the power, so a symptom is traced to its cause in one place.
The operating system, through the Zabbix agent and its full template.
The database engine: replication state, connections, buffer behaviour and slow queries.
Your pages: the homepage, the checkout, the login, an article page or an API endpoint, each checked for the right answer, fast.
The path underneath: network devices, storage and power, on the same platform.
The monitoring itself: after every change to the platform we prove the alert path end to end with a real alarm.
The network underneath, watched too.
Every router, switch, firewall and link we run is watched continuously, and our network is also measured from outside, from probes around the world, so a problem on the path is seen from the places your users are.
When it fires
An alarm is a message
to a person.
High and disaster severity alarms go straight to the operations channel where the engineer on call already is, day and night.
Filtered, then analysed.
Rules filter the known noise first. What is left gets a second opinion from AI models running on our own GPUs, inside our own datacenter. Your monitoring data does not leave our infrastructure.
How the analysis worksAn engineer acts.
The engineer on call investigates immediately. The people who read the alarm are the people who built your platform and can fix it.
Who answers, and how fastWe open the ticket.
If it affects you, the first message on the ticket is usually ours, with what we saw and what we did about it.
Why we move firstBefore you add it
What we watch,
and what you see.
Checks, alarms, access and response. Agree the scope with an engineer before it starts.
Ask an engineerAny server we host for you: a managed VPS, a dedicated server or the nodes of a cluster. We agree the checks with you when it starts.
Your next infrastructure partner
Add proactive monitoring
to any server we host.
Tell us which servers and which pages matter. We agree the checks, the thresholds and who hears about what, then we watch them every minute.
+357 222 32280
who will look after your infrastructure.
Let’s start with your setup.
A little context helps us start the right conversation.