

What we do · Operations
Fleet monitoring and alarm routing
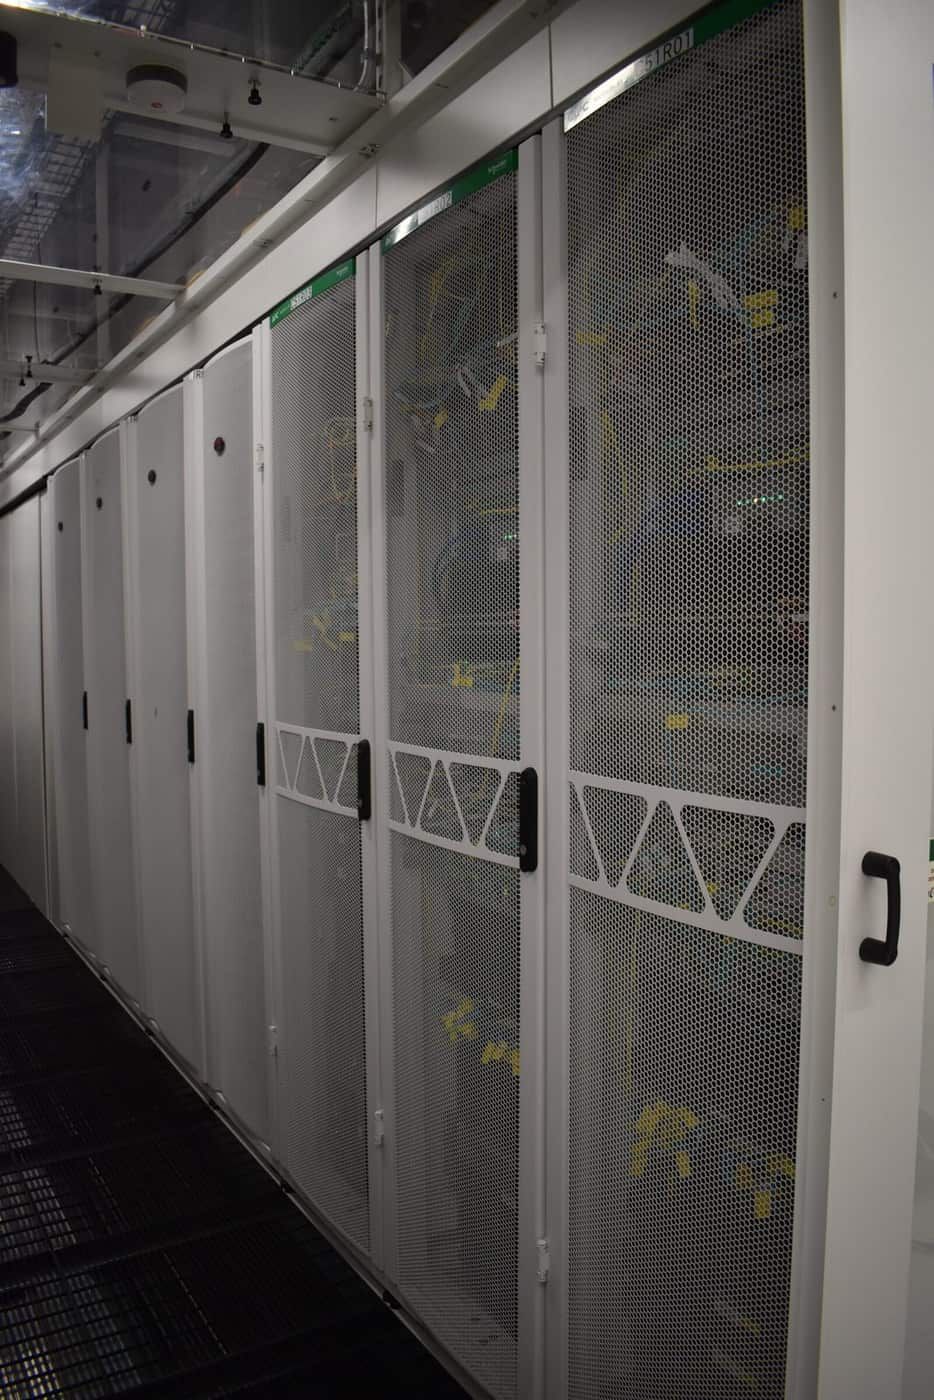
Every machine, switch, firewall, storage array, power strip and customer web address we are responsible for is watched by one central Zabbix platform, every minute of every day. When something goes wrong, the alarm lands in front of the engineer on call within seconds, usually before the first visitor notices anything at all. Every alarm also gets a second opinion from AI that runs on our own GPUs, inside our own datacenter.
What it is
A single monitoring platform that sees the whole estate: operating systems, databases, network devices, storage, power, and the pages your customers actually load. It is wired straight into the chat system our engineers live in, so an alarm is a message to a person, not a line in a log.
For customer clusters we monitor from the inside out. The operating system, the database engine and the application are measured, and a battery of real HTTP checks requests your real pages, the checkout, the login, the article page, the API endpoint, and checks that each one answers correctly and fast.
How we build it
- An agent on every host. Every server in a customer cluster gets the Zabbix agent and the full operating-system template, and hosts register themselves on first contact, so a new machine is never forgotten.
- Database metrics with a read-only user. Replication state, connections, buffer behaviour and slow queries are read through a dedicated monitoring account.
- Your pages, checked from the server. We agree with you which URLs matter, typically ten to fifteen of them, and check each for status code, content and response time.
- Alarms to people, not to inboxes. High and disaster severity alarms go by webhook to a dedicated operations channel in Mattermost, where the on-call engineer already is, day and night. After every change to the monitoring platform we prove the chain end to end with a real alarm, timed from trigger to message.
- A second opinion from local AI. Rules filter the known noise first. Everything left is analysed in real time by AI models running on our own NVIDIA A100 GPUs, inside our own datacenter. The analysis correlates the alarm with recent events, related hosts and known patterns, and puts a second opinion beside the alarm for the engineer. Your monitoring data never leaves our infrastructure and is never sent to a public AI service.
- Thresholds tuned per host, never silenced blindly. We set per-host overrides instead of editing shared templates, so tuning one machine never changes the alarms on another, and a trigger is never switched off just to make a dashboard green.
- The monitor is monitored. The monitoring platform itself is audited top to bottom (hardware, operating system, database, daemon, alert path) and runs on a compressed time-series database with enforced retention.
What it protects you from
- An outage you first hear about from a customer.
- A site that returns a page, but the wrong page, or an error dressed up as a page.
- A database replica that quietly stopped replicating days ago.
- Alarm fatigue: hosts that have been red for months until nobody looks.
- A monitoring system that is itself failing while looking healthy.
In practice
A news publisher's cluster, onboarded in a morning. A news publisher moved its application cluster to us. In one morning every node had the agent and the full template, the database had its read-only monitoring user, and a battery of fifteen real page checks covering the homepage, article pages and feeds was live, every one of them green. From that day, a slow article page is something we see first.
Why EuroVPS
- One platform sees your servers, your network path, your storage and your power, so a symptom is traced to its cause in one place.
- Alarms reach a named engineer on call 24/7 in seconds, with real-time AI analysis on our own NVIDIA A100 GPUs beside them.
- We check your real pages, not just whether the server answers a ping.
- Thresholds are tuned for your machines, not left at vendor defaults that cry wolf.
- The people who read the alarm are the people who built your platform and can fix it.
FAQ
Can I see the graphs and alarms for my own servers? Yes. We can give you read-only access to your hosts, or send you a scheduled summary. Most customers simply rely on us acting on the alarm and telling them what happened.
Which pages do you check? The ones that make you money or would embarrass you if they broke. We agree the list with you at the start and change it whenever your site changes.
Does the AI send my data anywhere? No. The models run on our own NVIDIA A100 GPUs in our own datacenter. Nothing leaves our network, and nothing goes to a public AI service.
What happens when an alarm fires at 3 a.m.? It reaches the engineer on call within seconds, who investigates immediately. If it affects you, you get a ticket from us, often before you have noticed anything.
Do you open tickets proactively? Yes. Many of our tickets start on our side, because our monitoring saw something first.
If you want your platform watched by people who answer the alarm themselves, Talk to an engineer.
Your next infrastructure partner
Let’s look at
your setup.
Tell us what you run today and what needs to improve. An engineer will review your brief and help you plan the next step.
+357 222 32280
who will look after your infrastructure.
Let’s start with your setup.
A little context helps us start the right conversation.