

How to read a Galera cluster's health in five status variables
The wsrep status variables that tell you whether a Percona XtraDB or MariaDB Galera cluster is healthy, slow, or one step from losing quorum.
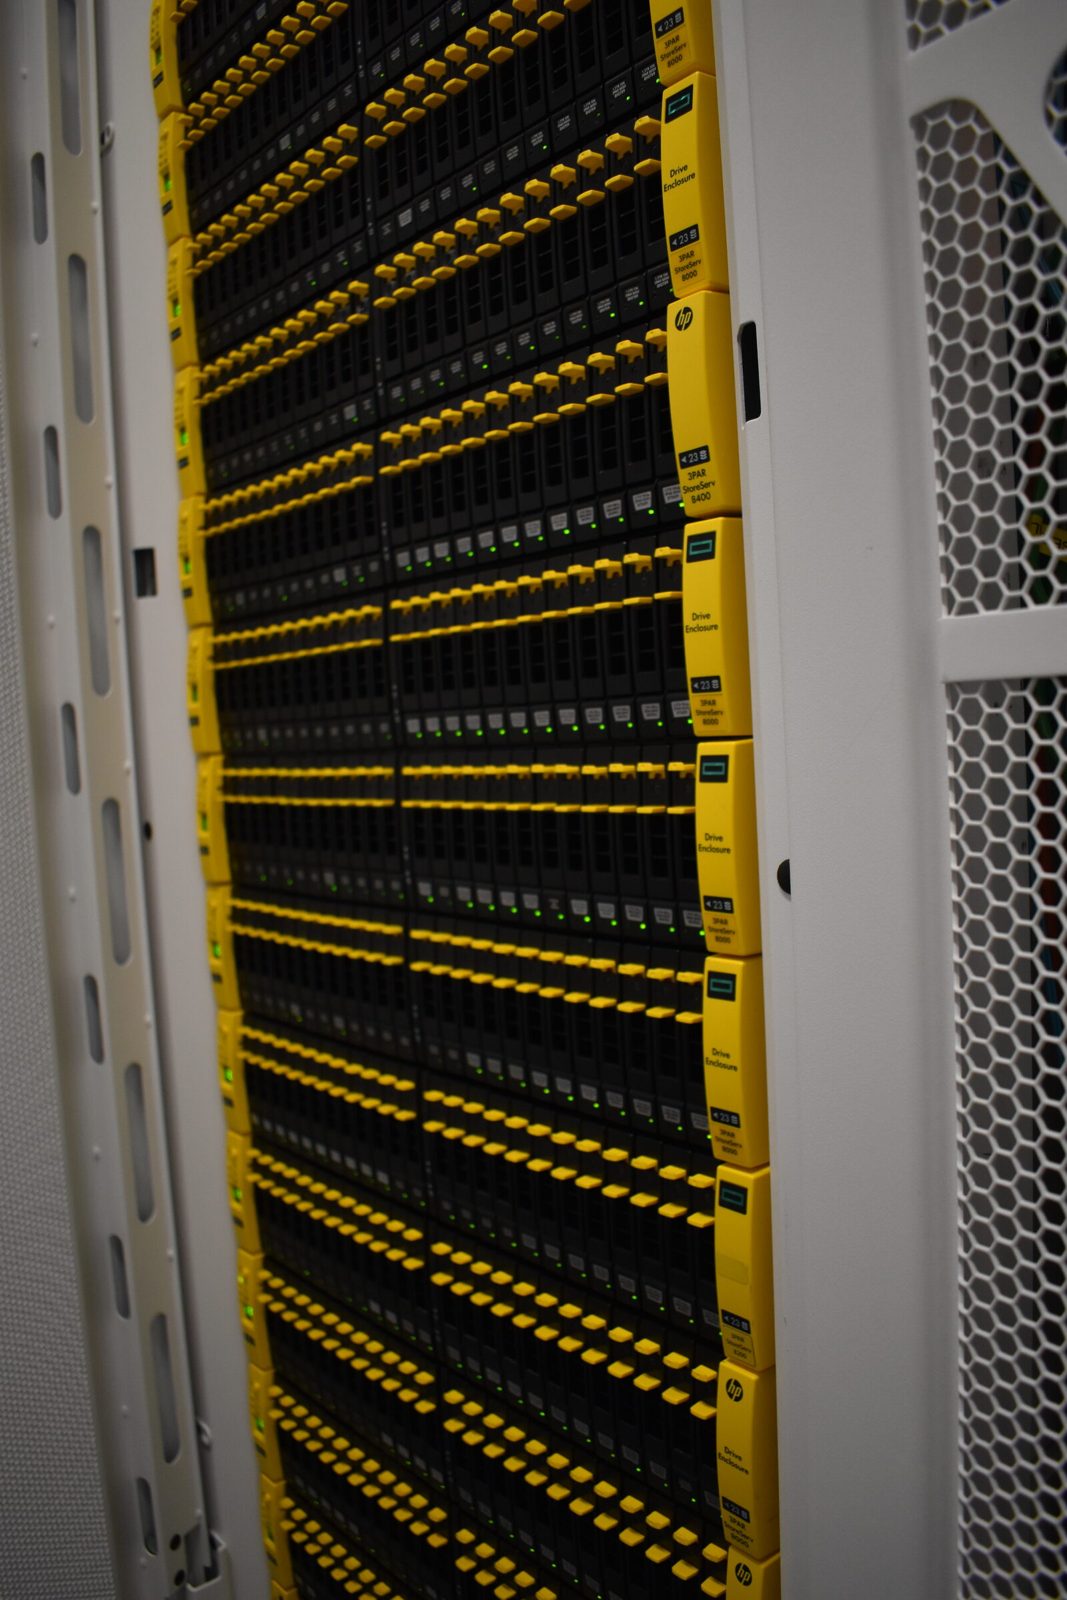
A Galera cluster (Percona XtraDB Cluster or MariaDB Galera) can look perfectly fine from the application while it is quietly running on two legs, throttling itself, or holding a node that will need a full copy to rejoin. Every one of those states is visible in a handful of status variables. This is how we read them, and what each one is telling you.
The problem: "it answers queries" is not a health check
Most monitoring for a clustered database checks the same thing it checked for a single server: is port 3306 open, does SELECT 1 return. A Galera node that has dropped out of the primary component still accepts connections. A node that is synced but applying writes too slowly still answers reads. A cluster of three that has quietly become a cluster of two still serves the site, right up to the moment the next node goes away and quorum is gone.
The cluster knows all of this about itself. You only have to ask it.
The one query to run on every node
SHOW GLOBAL STATUS WHERE Variable_name IN (
  'wsrep_cluster_status',
  'wsrep_cluster_size',
  'wsrep_local_state_comment',
  'wsrep_ready',
  'wsrep_cluster_state_uuid',
  'wsrep_flow_control_paused',
  'wsrep_local_recv_queue_avg',
  'wsrep_local_send_queue_avg',
  'wsrep_local_cert_failures',
  'wsrep_local_bf_aborts'
);
Run it on every member, not just the one your load balancer happens to reach. Several of these values are local to the node, and the interesting failures are the ones where nodes disagree.
Membership: is this node really part of the cluster?
wsrep_cluster_status must be Primary. Anything else (Non-Primary, Disconnected) means this node has lost contact with the majority and will refuse to serve consistent data. If your health check does not look at this value, a partitioned node can keep receiving traffic.
wsrep_cluster_size must equal the number of nodes you built. This is the variable that catches "running on two legs". A three node cluster reporting two is still serving, still in quorum, and has no tolerance left. Alert on it as a warning the moment it drops below the design size, not when it hits one.
wsrep_local_state_comment should read Synced. Donor/Desynced means the node is feeding a joiner and may be slowed; Joining and Joined mean it is still catching up. A node in any state other than Synced should be taken out of the read pool by your proxy until it returns.
wsrep_cluster_state_uuid must be identical on every node. Two different values mean you have two clusters that each think they are the cluster. That only happens after someone bootstraps the wrong node, so it is worth checking after any manual recovery.
wsrep_ready simply confirms the node will accept queries; if it reads OFF, the other values will tell you why.
Performance: is the cluster holding itself back?
Galera replication is certification based: every node must agree that a write set does not conflict before it commits. That makes the cluster as fast as its slowest applier, and Galera enforces it with flow control.
wsrep_flow_control_paused is the fraction of time, since the last FLUSH STATUS, that replication was paused because some node could not keep up. Read it as a percentage. Near zero is healthy. Anything persistently above a few percent means writes are waiting on a slow node, and your application's write latency is paying for it. Flush, wait a known interval, read again, so the number describes the present and not the last month.
wsrep_local_recv_queue_avg tells you which node is slow. A node whose receive queue average sits well above zero is the one triggering flow control. Usually the cause is local: slower storage, a noisy neighbour, a long running report, or too few applier threads (wsrep_applier_threads, or wsrep_slave_threads on older releases).
wsrep_local_send_queue_avg rising points the other way: this node is struggling to send its own write sets, which usually means network latency or loss between members. It is the reason cluster members belong on the same low latency fabric, with off site copies handled by asynchronous replicas instead.
Conflicts: are you writing to more than one node?
wsrep_local_cert_failures and wsrep_local_bf_aborts count transactions rolled back because another node committed a conflicting change first. The application sees these as deadlock errors. A steady trickle on a cluster where every node accepts writes is the signature of multi writer contention, and WordPress and e-commerce plugins that update the same option or counter rows on every request produce it in volume.
The fix is architectural, not a tuning knob: send all writes to one node and spread reads. With ProxySQL that is a single row:
INSERT INTO mysql_galera_hostgroups
  (writer_hostgroup, backup_writer_hostgroup, reader_hostgroup,
   offline_hostgroup, active, max_writers, writer_is_also_reader,
   max_transactions_behind)
VALUES (10, 20, 30, 40, 1, 1, 1, 100);
LOAD MYSQL SERVERS TO RUNTIME; SAVE MYSQL SERVERS TO DISK;
max_writers = 1 elects one writer, the others become readers and backup writers, and max_transactions_behind lets ProxySQL take a lagging node out of the read pool automatically. Once writes go to one node, these two counters should sit almost still.
If editors then complain that a save "disappeared" on reload, the read went to a node that had not applied the write yet. Setting wsrep_sync_wait for those sessions makes the read wait for the node to catch up, at a small latency cost.
Rejoining: will a node come back quickly or slowly?
A node that leaves and returns either receives the missing write sets from a donor's cache (IST, incremental and fast) or a complete copy of the dataset (SST, slow and heavy on the donor). Which one you get depends on whether the donor's write set cache, gcache.size in wsrep_provider_options, still holds everything the joiner missed.
You can size it from the cluster's own counters. Read wsrep_replicated_bytes and wsrep_received_bytes an hour apart; the sum of the deltas is roughly the write set volume per hour. Multiply by the longest maintenance window you expect, add a margin, and that is the gcache you need. A node can then be patched, rebooted, or held for hours of hardware work and still rejoin incrementally.
Quorum: the arithmetic behind "three"
Quorum is a strict majority. Three members tolerate the loss of one. Four members also tolerate only one, because two out of four is not a majority, so the fourth node buys capacity but no resilience. Two members tolerate nothing: if they lose sight of each other, both stop. If you genuinely have only two data nodes, add the Galera arbitrator (garbd) on a third, independent host so a majority still exists.
The same arithmetic applies to where the members live. Three nodes on one host, or three nodes whose data sits on one storage array, are one failure domain wearing three names. On Kubernetes, pair hard pod anti-affinity with a PodDisruptionBudget of minAvailable: 2, so a rolling node update can never take two members at once.
What to check on your own cluster this week
- Every node reports
Primary,Synced, the same state UUID, and the cluster size you designed. - Your health check and your proxy both use those values, not just a TCP connect.
wsrep_flow_control_paused, measured over a fresh interval, is near zero.- Certification failures are not climbing; if they are, writes are landing on more than one node.
- Your gcache covers your longest planned maintenance window.
- No two members share a host, an array, or (on Kubernetes) a disruption without a budget.
A Galera cluster that is read this way rarely surprises anyone. If yours does, we are happy to take a look.
Published 22 October 2026.
All field notes